Ira Taraday
By unlocking demographic information, businesses can make data-driven decisions that lead to increased growth and success. But this is not new information. The challenge lies in accurately matching sales data to census data to unlock that demographic information.
Within a recent project, we worked through the unique twists and turns associated with data matching. Keep reading to learn how we tackled those challenges and created a model that provided rich and insightful analytics.
The project
Our objective was to be able to pull census data to match a client’s sales data and create a model in order to measure the potential revenue of a sales territory. The client was hoping to use this data to better understand their sales territories, enhance their data with demographic information and create a measure of success for their territories.
To accomplish the client’s goals, we had to find a way to map their sales data back to territories that align with the census data. We then had to pull and test the census data to see what factors could be used to measure the potential revenue of the territory.
Data matching challenges
1. No easily defined territory
A problem we ran into is the client didn’t have a clear way of defining sales territories. We wanted to find something we could pull enough data from, but low-level enough that the client could create sales territories.
We found that we could pull census data at various breakdowns such as Census Division, Census Subdivision, Aggregations, or FSA (forward sortation area) levels. The FSA level was ideal for the client to create sales territories, but not many reports were available at that level of detail forcing us to use other breakdowns like Census Subdivision. Unfortunately, the various breakdowns also did not seem to roll up into each other. For instance, FSAs don’t roll up into subdivisions.
Take a look at the Hamilton Ontario Census Division for instance (green lined areas)
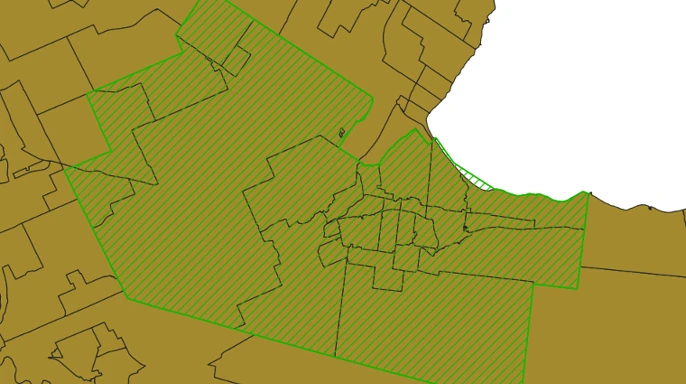
[Figure 1]. You can see multiple FSAs that make up the division:
1 / 2
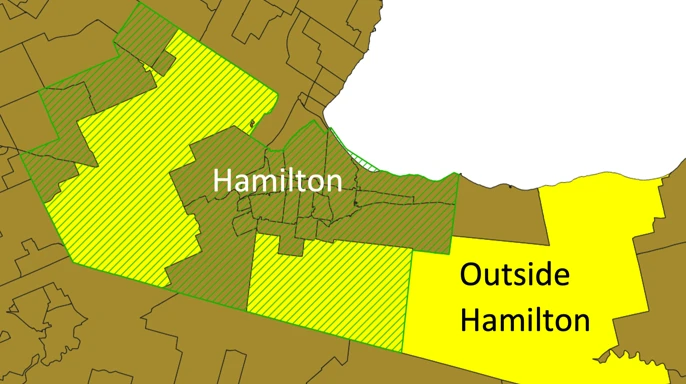
Looking more into those FSAs, they also can be part of multiple census divisions. For example, L0R (the yellow area) is partially in Hamilton and other divisions.
2 / 2
Census divisions worked well for bigger cities like Hamilton, but they were too big around smaller areas. For instance, Guelph is a subdivision area, but part of the Wellington census division.
We finally decided on using a subdivision. That covered a small enough area for the most part for the client at a (near) city level. The challenge with subdivisions was that some mega cities like Toronto were covered under 1 subdivision, while others like Montreal had multiple subdivisions in the city.
2. Joining sales data with customer data
The next challenge we had was trying to join the client’s sales data to the census. The sales data was entered in free form and rarely were we able to find a direct way to map it to the census subdivision. Since a city could have multiple subdivisions (or not be a subdivision), and FSAs don’t flow nicely to census subdivisions, we wanted to get the geo-coordinates of the customers to try and figure out what subdivision they were part of.
To solve this, we created a fuzzy match from the sales data to another data source, helping us get more information on the customers (ex: geo- coordinates) and using it to try and fix any data entry errors with the sales data. Since we entered the data in free form, there were multiple problems creating a fuzzy match. Some of the biggest problems encountered were:
- The customer no longer existed and did not have any entries in the customer data set
- Incorrect data
- Short form/acronyms
To address this, we tried matching the name, postal code, and address within a subset of the customer data. We first started by trying to clean up the acronyms and short forms and doing a fuzzy match on the name within the same postal code of the customer data. If we got a good name match within the postal code subset, we spot-checked the match and considered it done.
If we didn’t get a good match on the name within the postal code, we expanded the subset to the city and FSA level (in case the postal code was wrong) and tried with the name and address. We used a weighted average favoring the name over the address to determine if a match looked good (this was to prevent false positives like 3 Young Street giving a very high match against 300 Young Street).
3. Fixing our “trusted” data sources
We used the customer data set to try and fix issues with the sales data and to add some additional information for our model. When we were working on the match, we did encounter errors in the trusted data source. These were simple mistakes. Some rows had lowercase postal codes whereas 99.9% of the rows were all uppercase, or the format was A1A1A1 instead of A1A 1A1.
We also had cases in the trusted source of missing data and had to fill in the missing data by trying to figure out how to best fill in the blanks. For instance, if a subdivision wasn’t listed in the data, we looked at all the entries for the same FSA and filled in the blank by taking the most popular subdivision for that FSA.
4. Mapping the customer data to census data
At this point, we had a way of mapping the sales data to customer data and were finally ready to start mapping the customers to a census subdivision. We used GeoPandas to map the coordinates of the customer to the map of the census subdivisions we got from Stats Canada. Using GeoPandas, we were able to join the customers to the census map and get a list of what subdivision they were part of. A few customers ended up bordering two subdivisions and were subsequently removed from our model.
5. Creating the model
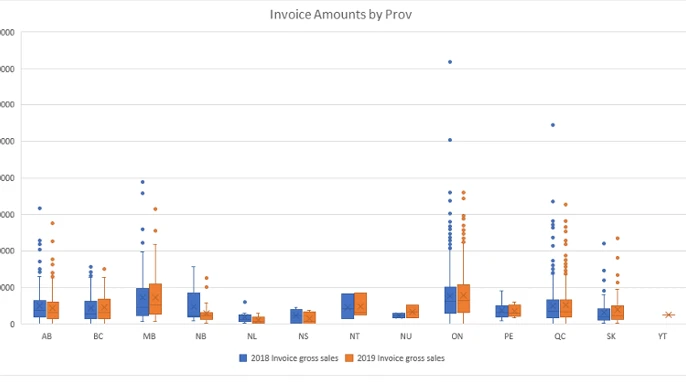
Now that we had the client’s data cleaned and able to link it to all the data sets, we were finally able to create our model. After performing an exploratory analysis looking at the sales invoices broken down by province, we noticed some outliers (especially in Ontario) and low data in the territories.
1 / 2
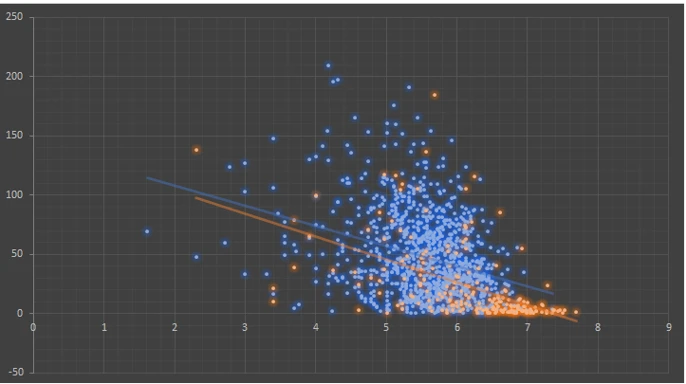
We tested various factors pulled from the census data like median income, household breakdown, population density, etc., and performed regression analysis to determine if the factors could be used to measure potential revenue.
2 / 2
Results
Since the client didn’t have a firm way of creating sales territories, we created a model that we were able to apply to all potential customers in the customer data set. We were then able to create territories based on City, Postal Code, FSA, Census Division, and Census Subdivision to create territories and map their sales to potential revenue. The client was now able to define how they wanted to create territories while easily viewing all potential customers and revenue for that territory to measure their performance against the model.
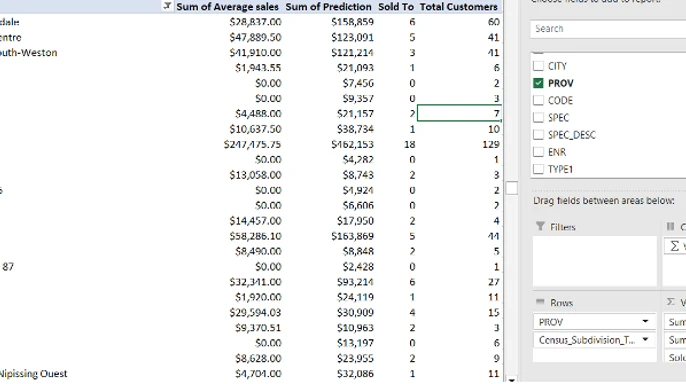
The final product was an easy-to-use Excel document with a summary pivot table that let the client quickly see sales and predictions by various territories we created the final model for (Census Subdivisions, Census Divisions, and Cities).
1 / 2
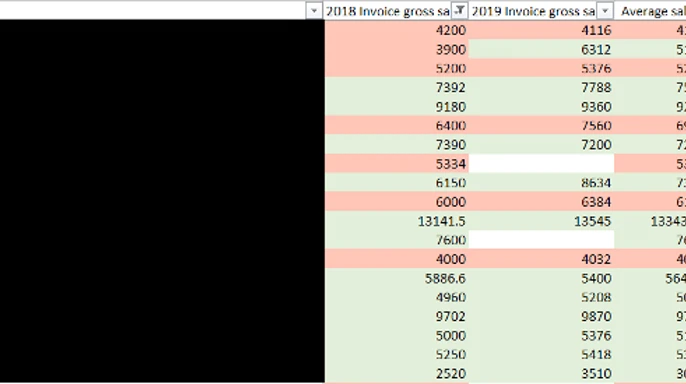
And a sheet of the cleaned-up data feeding the pivot table above. We made this easy for the client to break down all customers for a sales rep or territory.
2 / 2

